Telemetry & budget
How stella tracks usage locally, the opt-in Oxagen Enterprise export, spool diagnostics, and how --spend-limit becomes a hard spend cap.
stella tracks every run locally. Token usage, cost, step-by-step accounting, and the full record of what happened land in a SQLite file on your disk.
Telemetry only leaves your machine if you set it up to. A default install creates no telemetry spool and no telemetry network client at all. The model provider you picked stays stella's only normal network path, and the local Observatory stays loopback-only.
Exactly two things count as turning on telemetry export. Both need explicit local configuration, both do nothing until you write them, and neither can be switched on by a file that ships inside a project:
- Oxagen Enterprise managed enrollment. This isn't a personal setting, and it can't be read from a project file. It needs a valid, signed document in the org-managed settings scope that authorizes one minimal category of operational events, one exact HTTPS destination, and execution with no extra background processes. If the enrollment is invalid, missing, expired, or unsupported, export stays off. Details below.
- A
drainblock in~/.stella/cloud.json.stella cloud syncsends staged telemetry rows to the destination named there. This is a separate path from the Enterprise export, with its own format, its own encoding, and its own endpoint. It only runs when the file has both anorg_id(written bystella cloud register) and adrainblock. If either is missing,stella cloud syncmakes no network calls at all, and nothing else in stella triggers it.
That's the complete list. Those two paths are the only ones in stella that send telemetry anywhere.
Local metering
Everything lands in one SQLite file: <workspace>/.stella/private/store.db.
Because it's a real SQLite file, you can inspect it with any SQLite client
after a run. For example: sqlite3 <workspace>/.stella/private/store.db.
Every execution, its model, and its cost are queryable right on your own
machine. WAL mode is on, so a read-only tool like
stella stats never blocks a live session. This
local store stays the source of truth even when an Enterprise seat is
enrolled. The managed adapter can only build the closed summary described
below from it.
What's in the store
Metering is only part of it. The store has 21 tables, a full record of what each run did, not just what it cost. The Observatory reads these same tables.
executionsOne row per run, goal, or chat turn: kind, prompt, provider and model, outcome, cost. Every other table is keyed off this one.
eventsThe full, ordered event stream for each execution. You can replay it, and it includes reasoning as it streamed in.
telemetryOne row per model call: input/output tokens, cache read/write/miss, cost, latency, retries.
files_touchedThe file-touch record for each execution: create/read/update/delete letters, line changes, and a JSON audit log. Rows come from whatever surface reported the file change.
tool_callsOne row per tool call, whether native, MCP, skill, or agent: its shape, timing, success, and bytes returned. Large outputs are never stored, only their size.
mcp_usagePer-call MCP log: server, tool, reason, call time.
skill_usageOne row per skill applied in a turn, with the skill's pinned version.
agent_usesOne row per invocation of an installed agent definition, with its pinned version.
memory_citationsA record for each memory cited in a turn: its usefulness score and whether it held up as true.
forgottenRecords of anything a person has explicitly told stella to forget, whether it's steering the agent or not. One entry per item, with the forgotten text copied in at the moment it was forgotten. That copy is what makes the removal stick even if stella tries to relearn it: the reflection recorder and the skill miner compare new candidates against it, so a reworded version with a brand-new id still gets caught. This is different from quarantine, which is based on citation counts. This one is a person's judgment: they read it and said remove it. Undoing it is a plain delete.
rulesPromoted workspace rules: the full rule text, one row per rule.
reflectionsDurable lessons and self-critiques, tagged by domain.
execution_reflectionThe self-review written after each turn, linked one-to-one with its execution. It pairs the model's own rating with objective facts (did it produce output, did it write files, was it cut off), so a silent, zero-output turn shows up as a failure even if the model rated itself well.
tasksThe latest task-board snapshot, one row per task per session.
pull_requestsTracked pull requests: status and CI result, keyed by URL.
file_locksCooperative file claims for multi-agent work.
graph_nodes / graph_edgesTwo tables reserved for future use. The code graph itself lives in
.stella/private/codegraph.db, not here.
Step receipts
Three of the twenty-one tables exist to answer one question: what exactly did the model see at step N, and why was it allowed to see that much? Together, they let you reconstruct a past step without keeping a copy of the prompt. Replay the order, and the numbers match the decision that was actually made.
context_blocksOne row for every durable, separately trackable piece that entered a
step's prompt. Each one is created once and keyed by a block_id based
on its content. It carries kind, token_cost, content_digest, and
citation_label, and it's deliberately content-free: it only holds
a fingerprint of the content, never the content itself, which lives in
the original event in the journal. call_id and memory_id link back
to the tool call or memory node that created it. If the exact same
block enters context again, it resolves to the same id, so registering
it a second time changes nothing instead of creating a duplicate.
step_manifestOne row per step-and-block pair, in the exact order they were sent.
This is the receipt that lets you reconstruct a past step: replay the
content plus this order, and you get exactly what the model saw.
call_seq separates the several model calls that can share one step
(the worker, an overflow summarizer, other management roles).
cache_zone and resident_since_step record where a block sat and how
long it had been carried. call_id gives per-occurrence attribution
that a content-based block id can't. Its reverse index — every step a
given block was present for — is what cost-of-carry and eviction
analysis read.
step_receiptThe header for the manifest: one row per model call, not per step.
It records provider, model, call_role, effective_budget_tokens,
calibration_factor, and estimated_input_tokens. This is the exact
budget the compaction pass compared against, so a receipt's numbers
match the decision it documents instead of a number recalculated
later.
Those twenty-one are the tables the store owns, the ones tracked by the
migration history. store.db also has the optional enterprise_export_*
tables, which are set up separately, outside that history, and only
created after a fresh-file check runs. They only exist where a managed
enrollment does.
The same stream, on screen
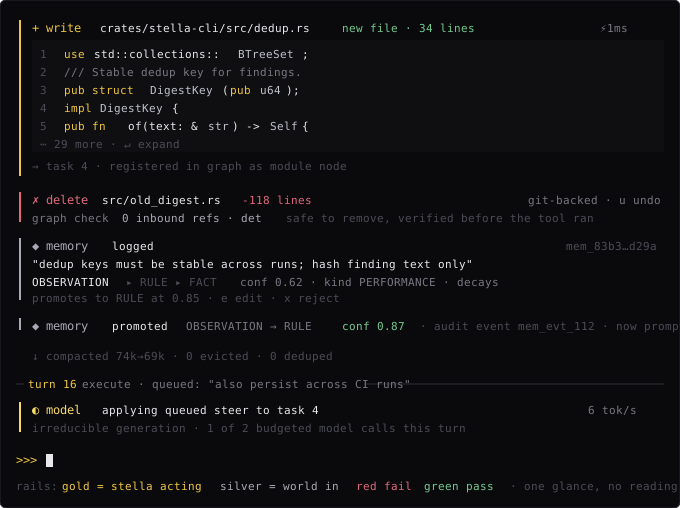
The event stream is what the interactive transcript displays, and each kind of event gets its own color: gold for when stella acted on the world, silver for when the world sent something back, and red only for failures. A delete shows the check that ran before the tool did. A memory shows its promotion from observation to rule. A compaction shows as one dim line instead of a wall of text.
Querying it yourself
It's an ordinary SQLite file, so any tool that speaks SQLite can read it. Here are the five most expensive runs in this workspace:
sqlite3 -json .stella/private/store.db \
  "SELECT id, kind, model, outcome, cost_usd
     FROM executions
    ORDER BY cost_usd DESC
    LIMIT 5" \
  | jq -r '.[] | "\(.cost_usd)\t\(.model)\t\(.outcome // "—")\t\(.kind)"'
And the receipts for one run: every model call, what it estimated it was sending, and the budget it was measured against:
sqlite3 -json .stella/private/store.db \
  "SELECT step, call_seq, call_role, model, estimated_input_tokens, effective_budget_tokens
     FROM step_receipt
    WHERE execution_id = 42
    ORDER BY step, call_seq" \
  | jq -r '.[] | "step \(.step).\(.call_seq)\t\(.call_role)\t\(.estimated_input_tokens)/\(.effective_budget_tokens)"'
Who served the call
step_receipt.provider (and the telemetry table's own provider column)
names the provider you configured. For an OpenRouter run, that's
always the string openrouter, the gateway itself, never the vendor it
routed to. Pinning the upstream
stops the gateway from routing inconsistently between calls. To audit
which vendor actually served a past call, read
step_receipt.upstream_provider, the column that records exactly that:
sqlite3 .stella/private/store.db \
  "SELECT step, call_seq, provider, upstream_provider FROM step_receipt
   WHERE execution_id = 42 AND upstream_provider IS NOT NULL
   ORDER BY turn_instance, step, call_seq"
stella inspect shows the same thing without any
SQL. The call listing shows openrouter→Amazon Bedrock in its PROVIDER
column, and --format json includes upstream_provider for each call.
This column is NULL on a direct endpoint, where provider is already
the right answer, and on any receipt recorded before this column existed.
For those older executions, the raw events payload of the step_usage
event is the only place to find it:
sqlite3 -json .stella/private/store.db \
  "SELECT payload FROM events WHERE execution_id = 42 AND event_type = 'step_usage'" \
  | jq -r '.[].payload | fromjson | select(.upstream_provider) | "\(.provider) → \(.upstream_provider)"'
Oxagen Enterprise managed export
Managed mode exists for visibility across seats, capacity planning, and
cost and reliability diagnostics. It does not take in stella fleet runs;
that execution surface is rejected under the current process-free rules.
This is operational telemetry, not compliance evidence: it doesn't
produce an audit trail, prove policy compliance, capture content for
investigations, or replace an organization's SIEM or records-retention
tools. The compliance_audit event class is explicitly not supported.
Product boundary
stella stays the local execution tool: provider calls, tools, workspace access, the full event stream, context, and the Observatory all stay on your machine. Oxagen is the optional Enterprise control plane. It can provision signed enrollment and receive the minimal operational summary described here.
stella implements enrollment verification, the projection step, a durable spool, and the HTTPS delivery client. A production Oxagen intake, with matching authentication, schema checks, safe retries, multi-tenant support, retention, and monitoring, is a separate server requirement. These docs don't claim that intake is already running.
Enrollment and authorization
Only the org-managed settings file can carry enterprise_telemetry
(normally /Library/Application Support/stella/settings.json on macOS, or
/etc/stella/settings.json on Linux). Project and user scopes can't
enroll a seat. Provisioning writes something shaped like this. The
signature is generated over the exact bytes of the claim, so this is
something your administrator's provisioning tool produces, not something
you'd hand-edit yourself:
{
  "enterprise_telemetry": {
    "verification_secret_env": "STELLA_ENTERPRISE_SIGNING_SECRET",
    "allowed_issuers": ["oxagen-enterprise"],
    "allowed_audiences": ["stella-cli"],
    "allowed_endpoints": ["https://telemetry.example.com/v1/stella/operational"],
    "host_data_isolation": "process_free",
    "enrollment": {
      "claims": {
        "schema": "stella.enterprise.telemetry.enrollment.v1",
        "issuer": "oxagen-enterprise",
        "audience": "stella-cli",
        "enrollment_id": "enrollment-42",
        "organization_id": "org-42",
        "workspace_id": "workspace-7",
        "endpoint": "https://telemetry.example.com/v1/stella/operational",
        "credential_env": "STELLA_ENTERPRISE_BEARER_TOKEN",
        "event_classes": ["execution_rollup"],
        "host_data_isolation": "process_free",
        "model_catalog": [
          { "provider": "anthropic", "model": "claude-sonnet-4-5" }
        ],
        "issued_at_unix_s": 1784592000,
        "expires_at_unix_s": 1787184000
      },
      "signature_hex": "<64 lowercase hex characters generated by provisioning>"
    }
  }
}
The signed endpoint and an administrator's allowed-list entry must resolve to the exact same credential-free HTTPS URL. Redirects, credentials in the URL, query strings, fragments, plain HTTP endpoints, proxy-derived destinations, and hosts that merely look similar are all refused. The issuer, audience, event class, process-free mode, lifetime, signature, and secret references are also checked before activation. An enrollment is valid for at most 90 days, and provisioning has to renew it.
Eligible execution path
An enrolled process runs under restricted authority. Right now, the only eligible surface is the raw one-shot step loop:
stella run "update the parser and run its in-process checks"This mode disables shell and process access, test-process access, skill
install and search, web access, and reading host media paths. Wrapped
runs, goal, fleet, the Command Deck, chat, interactive sessions, and
workspace-port or candidate-workspace execution are all rejected while
managed export is active. Enrollment narrows what can run. It never
quietly exports from a surface that isn't eligible.
Exported envelope
Only a finished run, after enrollment, can produce one
stella.operational.v1 / execution_rollup event. Its fixed schema
contains:
- managed enrollment, organization, and workspace identifiers;
- an approved provider and model pair, or a limited
otherbucket; - finalized outcome, duration, input/output token totals, and cost in micro-USD;
- tool-call count, changed-file count, and whether output was produced; and
- a consistent, destination-specific event ID used for safe at-least-once delivery.
It has no fields for prompts, responses, paths or filenames, tool names, tool arguments or results, reasoning, errors, git state, memories, rules, full local events, local execution IDs, or raw installation or store identifiers. These values aren't removed after the fact. There's simply no place for them in the export format.
Spool and retry
When a run finishes, stella first records a durable local export intent,
then builds an eligible summary into an owner-only SQLite spool, kept
outside the workspace the model can write to. On a later run, up to 256
pending intents are caught up before delivery. Stored event data is
capped at 10,000 rows and 16 MiB. SQLite's own pages, indexes, WAL/SHM
files, and quarantine metadata can make the actual database bigger than
that, so status reports the physical size separately. When the data cap
is hit, the oldest row not already being sent for the active destination
is dropped, and the durable dropped counter goes up.
Delivery happens at least once, per destination. A flush reserves at most 50 events and 256 KiB for 30 seconds, refuses redirects, and only marks rows as sent after a successful HTTPS response. If a credential, connection, or server error happens, the reservation is released and retried with growing delays plus some randomness: from one second up to five minutes, with the randomness capped at 25%. If your system clock goes backward, that's corrected using a destination-specific safeguard.
Changing the signed destination never sends old rows to the new one. Those rows become stranded until the old enrollment is restored, or an administrator explicitly discards them:
stella telemetry rollover-discardThis is a destructive action, and it increases a durable
rollover_discarded counter. Capacity limits, corruption, and rollover
loss all stay visible this way, instead of being silently counted as
delivered.
Status and flushing
These commands need no model provider or API key:
stella telemetry status
stella telemetry flush
status reports either disabled (no managed enrollment) or enrolled,
then pending and stranded rows and bytes, quarantined diagnostic rows and
bytes, the physical size of the spool, and running totals for dropped,
corrupt-dropped, and rollover-discarded rows. Invalid or expired managed
configuration shows an error instead of falsely reporting that it's
enrolled.
flush tries one delivery batch right away and reports sent, pending, and
dropped counts. stella also starts a background best-effort flush after
enrollment is checked at startup. That background attempt never blocks
anything: it never delays agent work, and stella doesn't wait for it when
shutting down. Run flush yourself when you need to make sure delivery
happens right before maintenance.
Budget: observed vs. enforced
The --spend-limit flag (or the STELLA_SPEND_LIMIT environment variable)
sets a dollar limit for the whole run or session.
- Observed mode (the default, no
--spend-limit) tracks spend for the end-of-run cost summary, but never blocks anything. Use it to see what a task costs. - Enforced mode (
--spend-limit <usd>) is a hard cap. Once total spend goes over the limit, work stops cleanly, never in the middle of a tool call, so you're never left with a half-finished edit.
# Observed: meter the cost, never block
stella run "summarize the architecture of this repo"

# Enforced: stop cleanly once spend passes $2.00
stella --spend-limit 2.00 goal "all tests pass and clippy is clean"

# Via environment, e.g. in CI
export STELLA_SPEND_LIMIT=5
stella run "port the utils module to the new API"
The limit must be a positive dollar amount. It applies to the whole run or interactive session, not to each turn.
Cost summary
Every run ends with a cost summary built from the same tracking that feeds the local SQLite store, so the number you see matches what was recorded locally.
Seeing your usage
stella observe: the Observatory, a loopback-only web dashboard (defaulthttp://127.0.0.1:7787/). Shows runs, spend, resolve rates, cost per resolved task by model, tool and file leaderboards, memory, MCP traffic, and the fleet log.stella stats: the same per-provider and per-model numbers, right in the terminal, as a table, JSON, or CSV./export(in the Command Deck): a portable ZIP, scoped to the session you're in so it's safe to share. Holds raw JSON dumps, a self-containeddashboard.htmlreport, and atranscript.htmlreplay of the session. See the dashboard page.
Self-improvement
How stella learns from its own work. The parts that change what it can do, what each one checks before a change sticks, and how to undo each change.
Observatory dashboard
stella observe opens a local, loopback-only dashboard over your workspace's telemetry — runs, spend, models, tools, files, and the fleet log.